![]() Tunnel theta is the metric that describes the change in the fair value of a tunnel option due to a change in time to expiry. The tunnel option is the first derivative of the tunnel fair value with respect to a change in time to expiry. It is depicted as:
Tunnel theta is the metric that describes the change in the fair value of a tunnel option due to a change in time to expiry. The tunnel option is the first derivative of the tunnel fair value with respect to a change in time to expiry. It is depicted as:
![]()
where ![]() is theta and P is the tunnel price and t is the time to expiry.
is theta and P is the tunnel price and t is the time to expiry.
Evaluating Tunnel Theta
Tunnel Theta = Digital Call Theta(K1) ― Digital Call Theta(K2)
where the first term and second terms are the digital options call theta with strikes K1 and K2 respectively.
Tunnel Theta Over Time
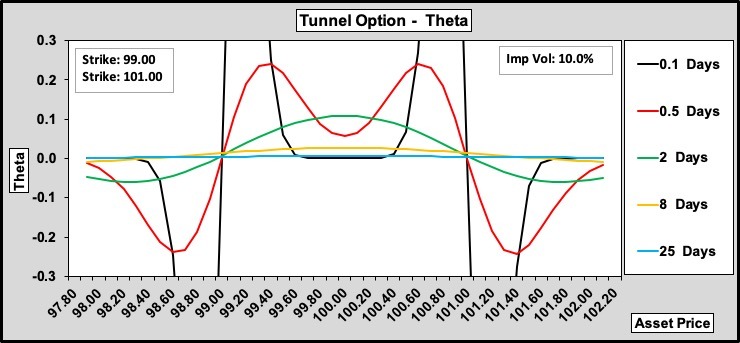
Tunnel theta is displayed against time to expiry in Figure 1.

At 10% volatility the 25-day and 8-day profiles are flat at zero or fractionally above zero at 100.00.
The red 0.5-day profile establishes a positive theta between the strikes and a negative theta outside the strikes. This is what one may expect on studying Figure 1 of tunnel options where it is apparent the price between the strikes rises and outside the strikes falls.
The 0.1-day to expiry profile shows that between the strikes the profile has fallen to zero. This is because between the peaks of the 0.1-day profile the tunnel price has already reached 100.00. The two peaks are yet reach 100.00 so are extremely positive.
Outside the strikes the asset price is out-of-the-money and the tunnel price is falling to zero hence the negative zero.
| European Digitals | Tunnel Options | Tunnel Delta | Tunnel Gamma | Tunnel Vega |
Tunnel Options and Volatility
Figure 2 presents a very interesting set of profiles. The 2.00% profile shows that between the strikes the theta is still just positive meaning that the tunnel value is still approaching 100.00. Outside the strikes the 2.00% profile is negative as the tunnel becomes a lost cause to the holder.

The interpretation of the 6% to 18% profiles is fairly clear. The hump between the strikes reflects that the tunnel value of all volatilities is positive.
The 18% profile shows a positive theta across the underlying asset range. At 100.00 a reduction in time to expiry does not generate an increase in tunnel value as much as the 6%, 10% and 14% profiles.
The 6% and 14% profiles are about the same but are lower than the 10% profile. The 14% yellow profile is still rising while the 6% green profile is on its way back down.
Summary
A trader looking to use theta to establish when to buy or sell the tunnel can glean a great deal of information from this illustration. For example, if the underlying is at 100.00 then buying the 10% profile gives you the greatest gain assuming the underlying remains at 100.00 . Unfortunately, this constraint is an issue since a quick look at Figure 2 of tunnel options makes obvious the downside of the asset moving away from 100.00.